The company presents a number of financial metrics in the interim and annual reports that are not defined according to IFRS (APM according to ESMA’s guidelines). These performance measures are presented as supplemental information and are not always comparable with measures used by other companies.
For additional questions please contact our investor relations team at IR@heimstaden.com.
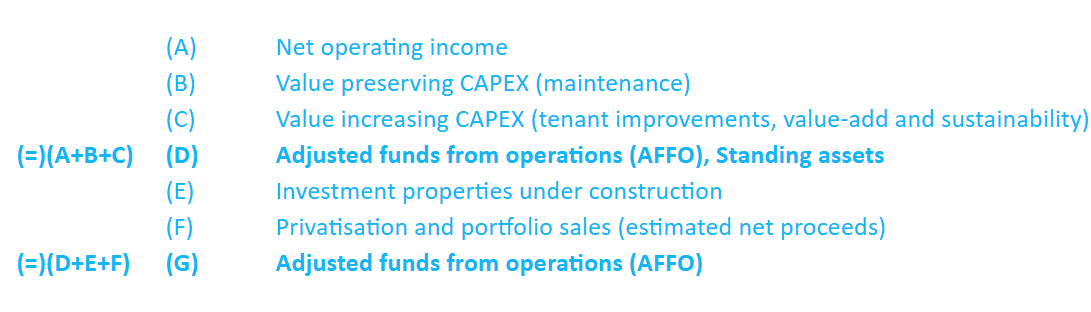
Adjusted Funds from Operations (AFFO)
Adjusted funds from operations is a cash-based metric used to evaluate operational drivers of cash generation of the business before interest expenses, including net proceeds from privatisations.
AFFO is net operating income, less value preserving capital expenditures (capex pillar maintenance), value increasing capital expenditures (capex pillars tenant improvements, value-add and sustainability), capital expenditure on investment property under construction, and adding estimated net proceeds from privatisation and other divestments.
Interest-bearing secured liabilities
Sum of secured loans and borrowings.
Interest-bearing unsecured liabilities
Sum of unsecured corporate debt.
Total interest-bearing liabilities
Sum of Interest-bearing secured liabilities and Interest-bearing unsecured liabilities.
Net interest-bearing liabilities
Total interest-bearing liabilities less cash and cash equivalents.
Profit before unrealized fair value adjustments
Profit before value adjustment of inventory properties and fair value adjustments of investments properties.
Residential income
Total rental income less income from service, commercial and parking facilities.
Regulated residential income
Total regulated residential rental income.
Fair value residential properties
Fair value of investment properties on balance sheet less commercial, garages and parking space properties.
Fair value investment properties
Fair value of standing assets (not under construction and excluding lease and land rights) on balance sheet.
Deferred tax not attributable to goodwill
Taxes that are owed but are not due to be paid until a future date not relating to goodwill.
Net Loan-to-Value (LTV)
Net loan-to-value ratio is interest-bearing secured liabilities and interest-bearing unsecured liabilities minus cash and cash equivalents as a percentage of fair value of investment properties. Net loan-to-value is an acknowledged measure of leverage and risk in the real estate industry. This ratio highlights Heimstaden Bostad's ability to manage financial liabilities given its fair value real estate portfolio.

Net debt / Net debt + Equity (S&P method) (%)
Equity (adjusted) is computed as equity plus 50% of principal amount of hybrid liabilities. Net interest-bearing liabilities adjusted (“Net debt”) is computed as the sum of total interest-bearing liabilities plus 50% of principal amount of hybrid liabilities and right-of-use liabilities less cash and cash equivalents. Net debt / (Net debt + Equity) is computed as net debt divided by net debt plus equity (adjusted). This metric is calculated according to S&P's rating methodology, with 50% of the principal amount of hybrid bonds classified as debt and 50% classified as equity (rather than the IFRS classification of the same instrument being 100% equity).
Net debt to total assets (%)
Net interest-bearing liabilities as a percentage of total assets.
Interest coverage ratio (rolling 12 months) (multiple)
Profit before unrealised fair value adjustment with adjustments for transaction costs from business combination and operating result from associated companies and joint ventures divided by net financial items. The interest coverage ratio is an industry standard ratio used to determine the extent to which Heimstaden Bostad's interest and debt servicing expenses are covered by operating profits. In addition, this ratio provides additional transparency on cash flow that is available after servicing debt obligations.

Interest coverage ratio, (S&P method) (rolling 12 months) (multiple)
EBITDA (adjusted) means Profit before unrealised fair value adjustment, plus depreciation and amortisation, the SOS partnership fee, transaction costs from business combination, privatisation cost, realised gain/losses from divestment of properties and share of net profits/losses of associated companies and joint ventures. Interest Expense (adjusted) means interest expenses on interest-bearing liabilities, adjustment of interest expense and 50% of the accrued (scheduled) dividend payments in respect of Heimstaden Bostad's outstanding hybrid capital as financial costs. The inclusion of 50% of the hybrid dividend payments reflects S&P's classification of Heimstaden Bostad's outstanding hybrid capital as being 50% debt and 50% equity (rather than the IFRS classification of the same instrument being 100% equity).

Regulated Income
Regulated income as a percentage of total residential income.
Residential share of investment properties %
Fair value of residential units as share of total fair value of investment properties.
Like-for-like rental growth, %
Rental income current year adjusted for acquisitions and divestments divided by comparable rental income previous year.
Net Operating Income Margin
Net operating income (NOI) for the period as a percentage of rental income for the period. This key performance indicator shows the profitability of the properties.
Economic occupancy ratio, residential (%)
Rental income from residential units divided by theoretical rental income on residential units including estimated rent for vacant apartments. Rent is estimated for a vacant apartment based on the most recent contracted rent for such apartment.
Real economic occupancy, residential
Rental income from residential units divided by rental income including estimated rent for vacant apartments adjusted for voluntary vacancies due to standard improvements. Rent is estimated for a vacant apartment based on the most recent contracted rent for such apartment.
Equity ratio (%)
Equity as a percentage of total assets.
EBITDA
Profit before unrealised fair value adjustment with reversal of amortisation and depreciation, including adjustments for transaction costs from business combination.
Debt / EBITDA (rolling 12 months) (multiple)
Time-weighted interest-bearing liabilities divided by profit before inventory properties and fair value adjustments with reversal of amortisation and depreciation and adjusted for transaction costs from business combination. Due to seasonality in EBITDA, this key performance indicator is calculated using the last 12 months' rolling data.
Secured loan to value
Interest-bearing secured liabilities as a percentage of total assets.
Liquidity Ratio
Total estimated sources of liquidity available for the coming 12 months including cash and cash equivalents at the balance sheet date, divided by total estimated cash usage for the coming 12 months. #
